How to make a data / report carousel (B2B)
Watch AI build it, step by step
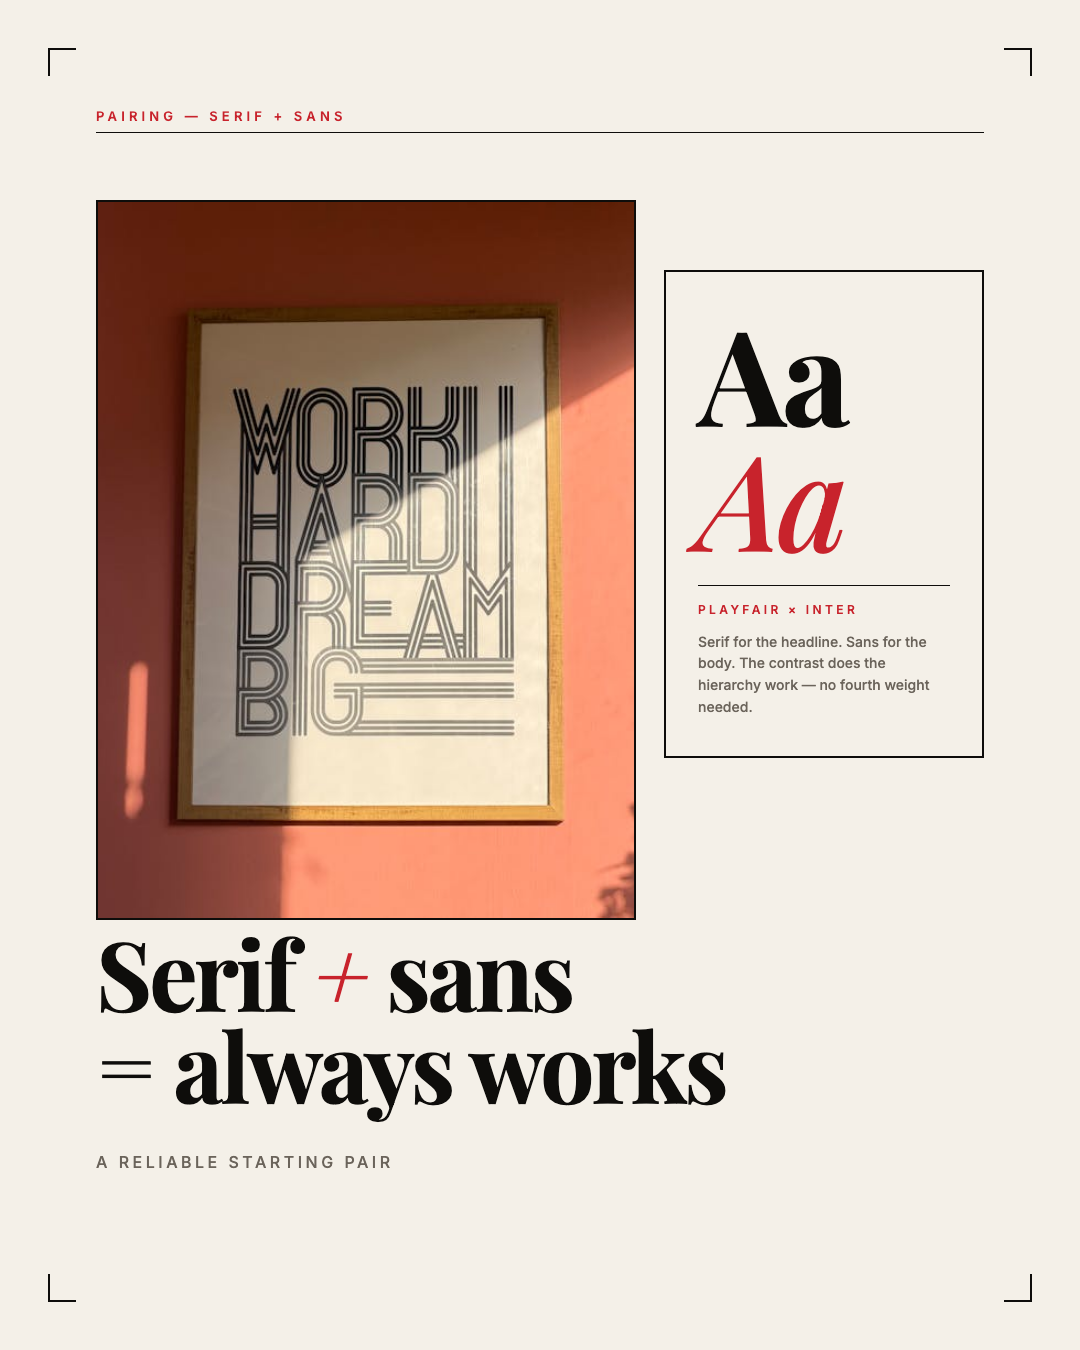
A report carousel has to look credible at a glance — clean grid, clear numbers, no clutter. Great for LinkedIn. The video above shows the data style in action.
- Open Start and enter the takeaway. (e.g. "Q3 retention report — 3 findings")
- List the numbers or findings you want on the slides.
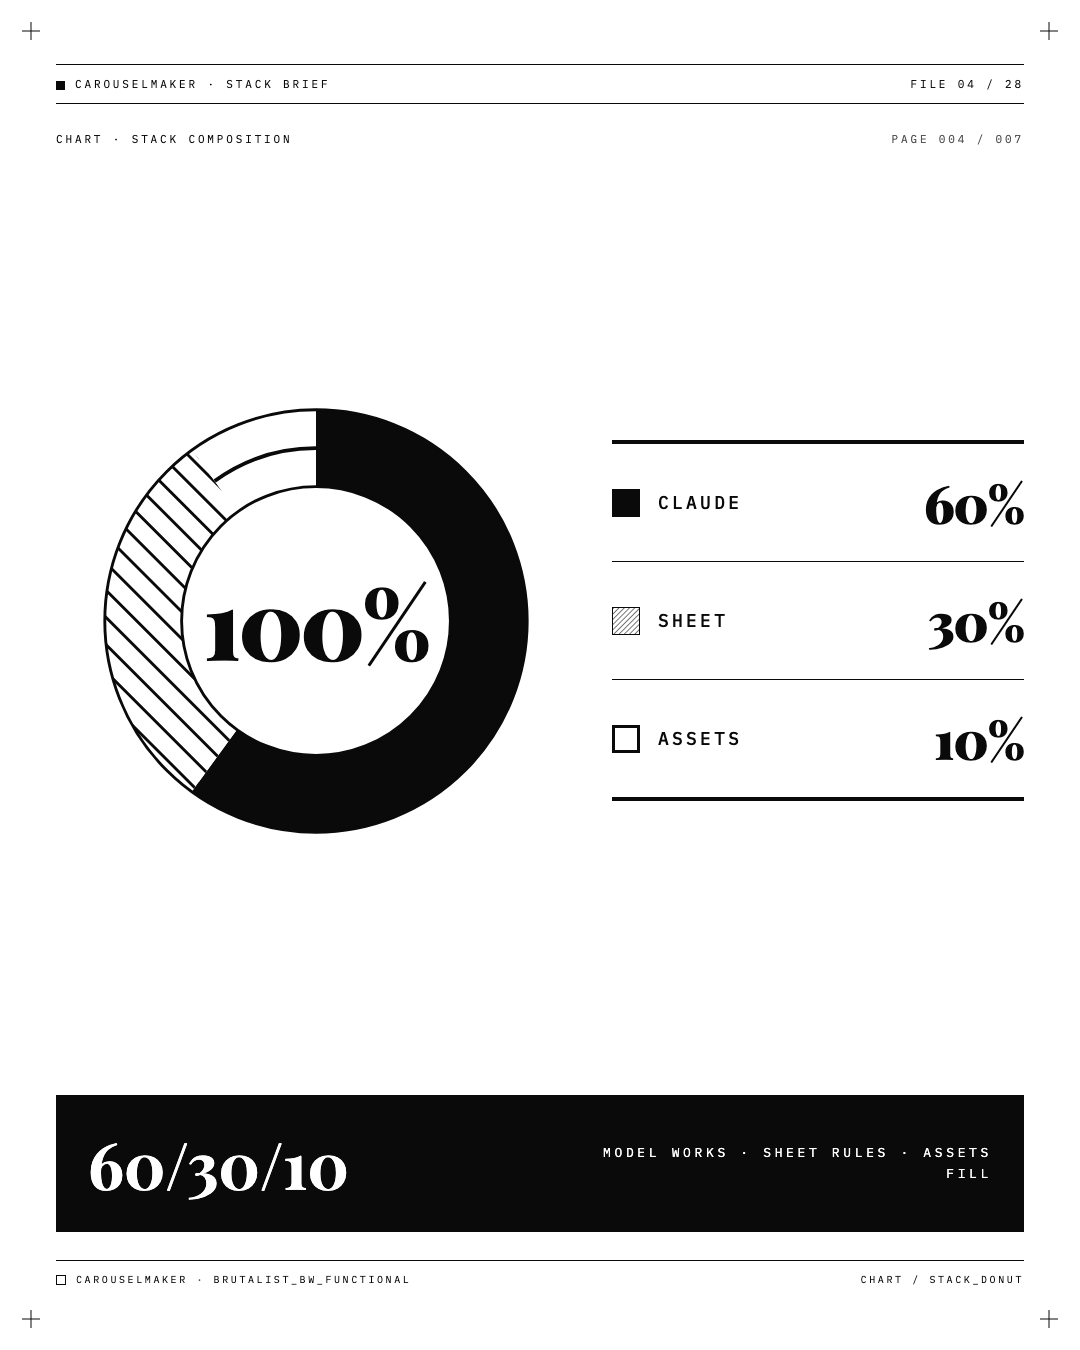
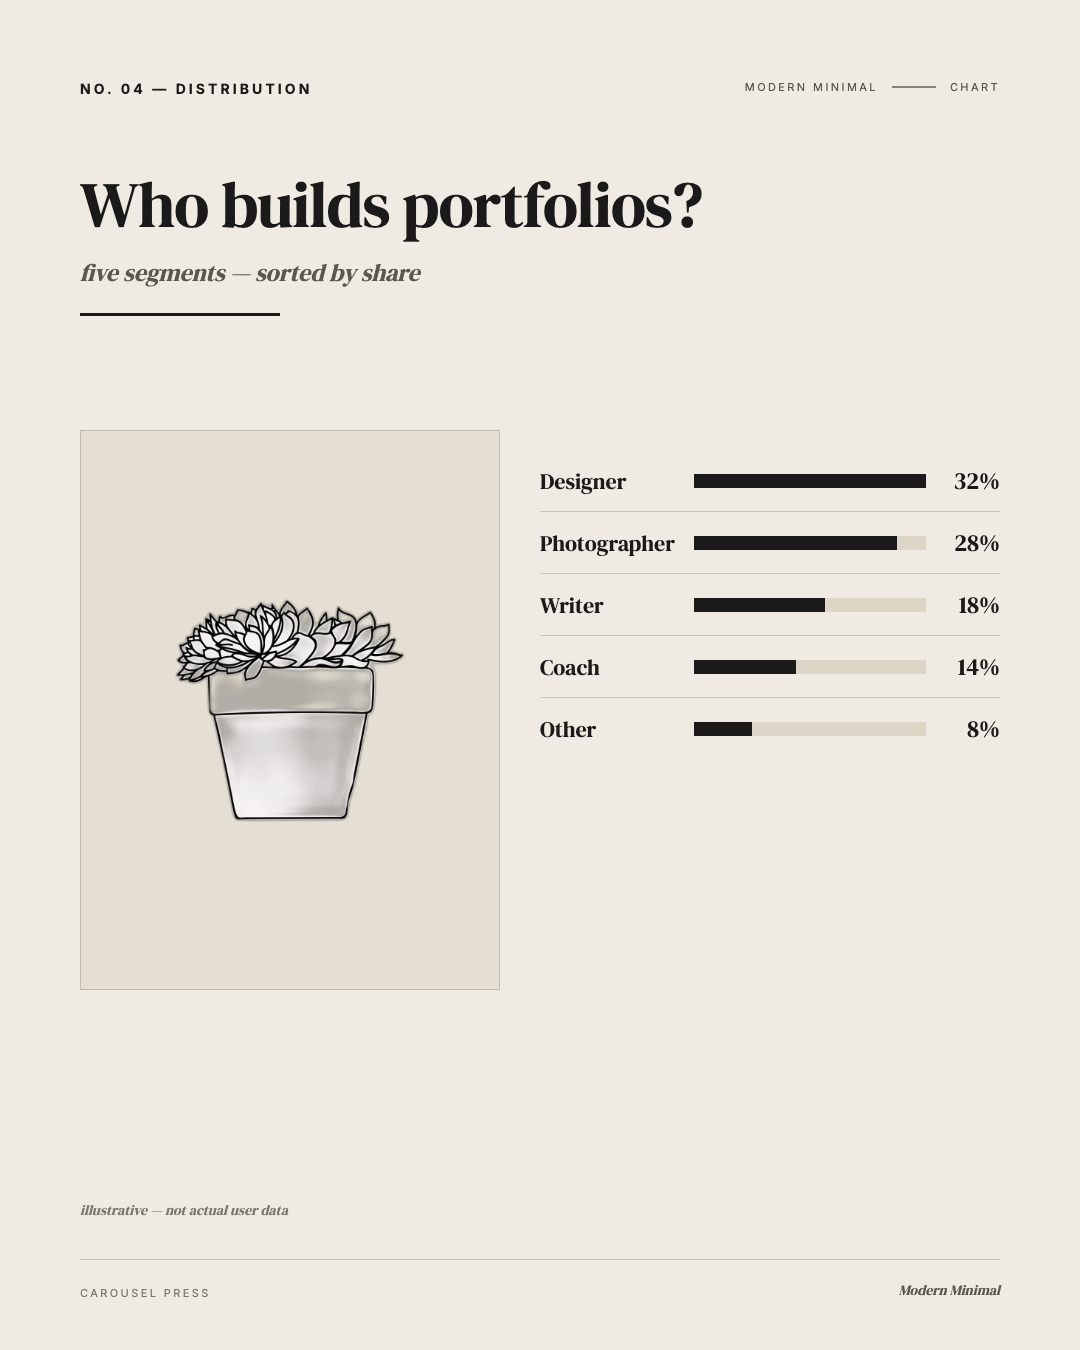
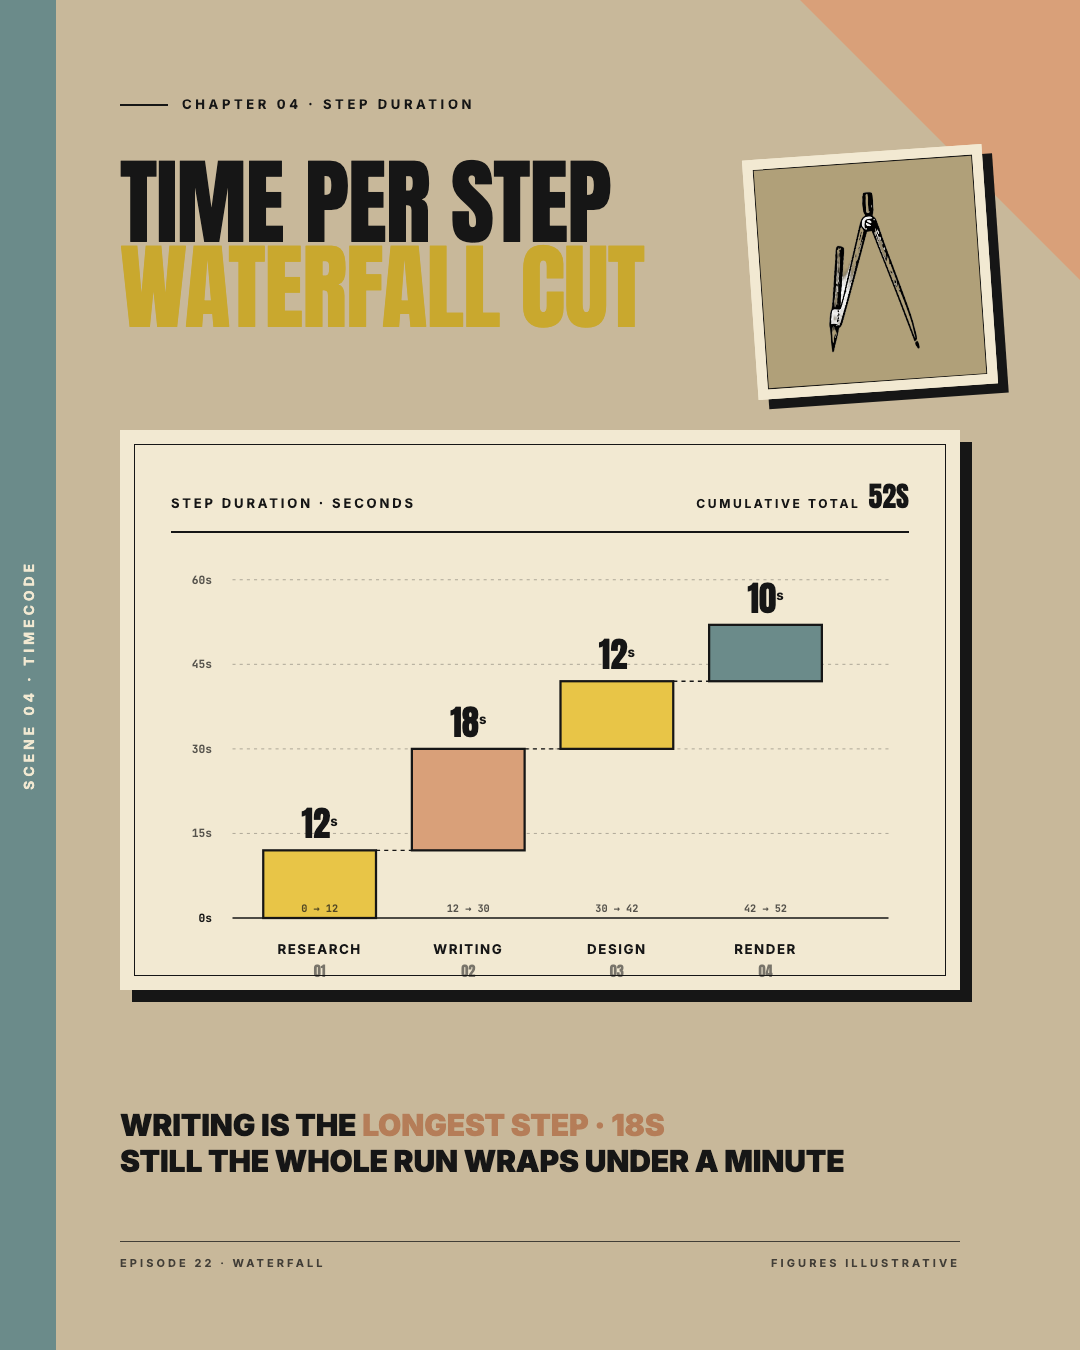
- AI builds the charts, figures, and a tidy monospace layout.
- Refine any slide in the chat until the story reads right.
- Export and drop it into your LinkedIn post.
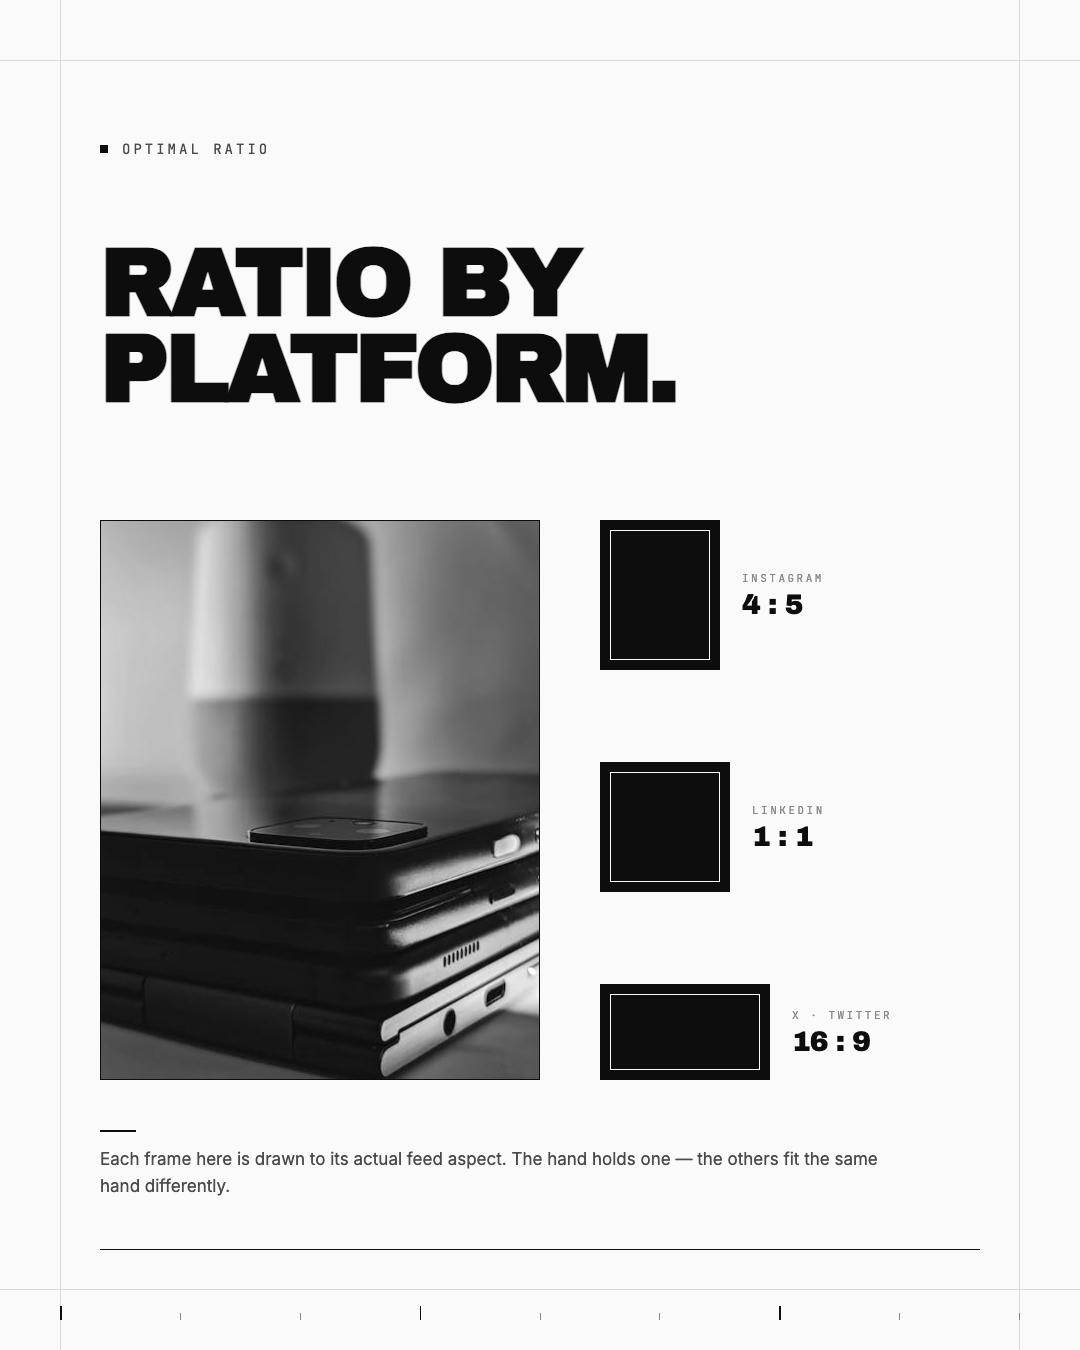
1:1 or 4:5 both work well on LinkedIn. One finding per slide keeps it skimmable.
Was this helpful?
Leave a rating to help us improve our help articles.
Thanks for the feedback
0.0 / 5 · 0 ratings
Ask us on Discord for a faster reply
Join Discord
Still have a question? Email lycoco067@gmail.com for help.